PS C:\Users\Shengjie> helm repo add loki https://grafana.github.io/loki/charts "loki" has been added to your repositories PS C:\Users\Shengjie> helm repo update Hang tight while we grab the latest from your chart repositories... ...Successfully got an update from the "stable" chart repository ...Successfully got an update from the "loki" chart repository Update Complete. ⎈ Happy Helming!⎈
PS C:\Users\Shengjie> helm search hub loki-stack URL CHART VERSION APP VERSION DESCRIPTION https://hub.helm.sh/charts/loki/loki-stack 0.38.3 v1.5.0 Loki: like Prometheus, but for logs. PS C:\Users\Shengjie> helm show values loki/loki-stack loki: enabled: true
PS C:\Users\Shengjie> helm install loki-stack loki/loki-stack --set grafana.enabled=true coalesce.go:165: warning: skipped value for filters: Not a table. coalesce.go:165: warning: skipped value for filters: Not a table. NAME: loki-stack LAST DEPLOYED: Sun Jul 26 11:58:11 2020 NAMESPACE: default STATUS: deployed REVISION: 1 NOTES: The Loki stack has been deployed to your cluster. Loki can now be added as a datasource in Grafana.
See http://docs.grafana.org/features/datasources/loki/ for more detail.
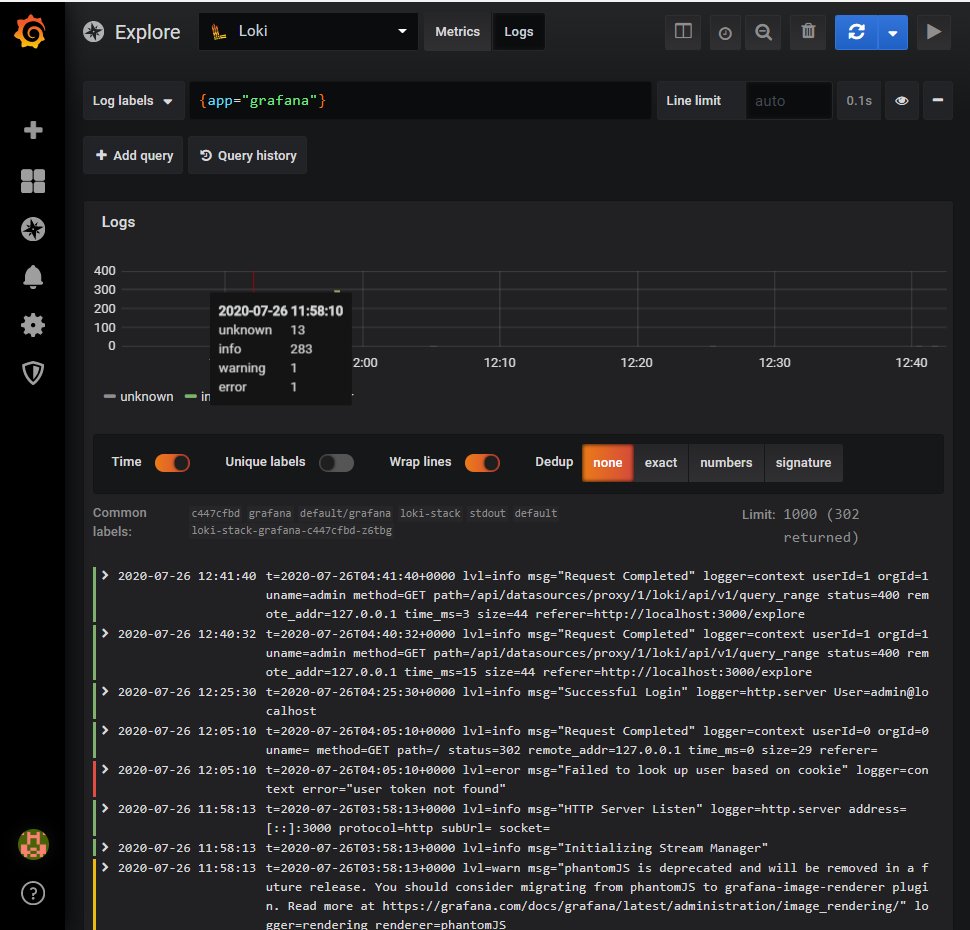
3. 登录Grafana 首先确认Loki是否成功部署:
1 2 3 4 5 6 7 8 9 10 11 12 13 14
PS C:\Users\Shengjie> helm list
NAME            NAMESPACE       REVISION        UPDATED                                 STATUS          CHART                   APP VERSION
loki-stack      default         1               2020-07-26 11:58:11.022896 +0800 CST    deployed        loki-stack-0.38.3       v1.5.0
PS C:\Users\Shengjie> kubectl get pod -w
NAME                                READY   STATUS        RESTARTS   AGE
loki-stack-0                        1/1     Running       0          2m33s
loki-stack-grafana-c447cfbd-z6tbg   1/1     Running       0          2m33s
loki-stack-promtail-j47hl           1/1     Running       0          2m33s
PS C:\Users\Shengjie> kubectl get svc -w
NAME                  TYPE        CLUSTER-IP      EXTERNAL-IP   PORT(S)    AGE
kubernetes            ClusterIP   10.96.0.1       <none>        443/TCP    56d
loki-stack            ClusterIP   10.110.83.209   <none>        3100/TCP   2m52s
loki-stack-grafana    ClusterIP   10.111.24.26    <none>        80/TCP     2m52s
loki-stack-headless   ClusterIP   None            <none>        3100/TCP   2m52s
Make sure you have Helm [installed](https://helm.sh/docs/using_helm/#installing-helm) and [deployed](https://helm.sh/docs/using_helm/#installing-tiller) to your cluster. Then add Loki's chart repository to Helm: $ helm repo add loki https://grafana.github.io/loki/charts
You can update the chart repository by running: $ helm repo update
## Deploy Loki and Promtail to your cluster ### Deploy with default config $ helm upgrade --install loki loki/loki-stack ### Deploy in a custom namespace $ helm upgrade --install loki --namespace=loki-stack loki/loki-stack
### Deploy with custom config
$ helm upgrade --install loki loki/loki-stack --set "key1=val1,key2=val2,..." ## Deploy Loki and Fluent Bit to your cluster $ helm upgrade --install loki loki/loki-stack \ --set fluent-bit.enabled=true,promtail.enabled=false ## Deploy Grafana to your cluster The chart loki-stack contains a pre-configured Grafana, simply use `--set grafana.enabled=true`
To get the admin password for the Grafana pod, run the following command: $ kubectl get secret --namespace <YOUR-NAMESPACE> loki-grafana -o jsonpath="{.data.admin-password}" | base64 --decode ; echo To access the Grafana UI, run the following command: $ kubectl port-forward --namespace <YOUR-NAMESPACE> service/loki-grafana 3000:80 Navigate to http://localhost:3000 and login with `admin` and the password output above. Then follow the [instructions for adding the loki datasource](/docs/getting-started/grafana.md), using the URL `http://loki:3100/`